Introduction
Running a solar motor farm is less about paying for daily fuel or grid electricity and more about managing upfront system design, efficiency losses, maintenance, and long-term asset performance. The real operating cost depends on how well photovoltaic output, motor demand, power electronics, and storage or hybrid backup are matched over time. For owners comparing irrigation, pumping, or remote industrial use cases, the key is to move beyond simple energy savings and measure total lifecycle cost. This article explains the main cost drivers, how they interact, and what metrics matter when evaluating a solar motor farm as a durable business asset.
What Drives the Cost of Running a Solar Motor Farm
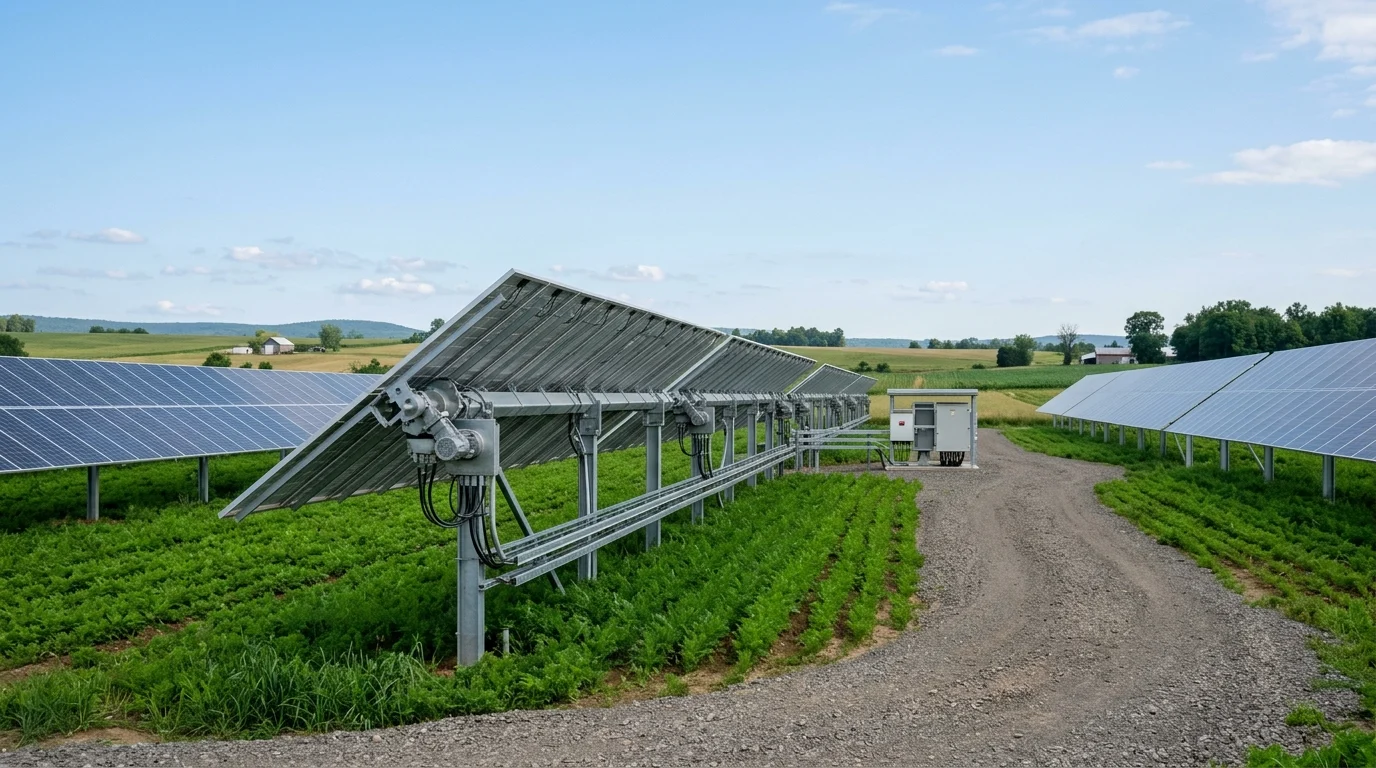
Deploying a solar motor farm—whether for agricultural irrigation, industrial pumping, or remote mechanical processing—requires a fundamental shift in how energy and operational expenditures are calculated. Unlike traditional grid-tied or diesel-driven motor systems, a solar-direct or solar-hybrid motor network front-loads the energy costs into the capital expenditure phase. Understanding the true cost of running these facilities demands an analysis of systemic efficiency, power electronics, and long-term asset management.
Operating a solar motor farm involves integrating photovoltaic (PV) arrays with variable frequency drives (VFDs) and high-efficiency electric motors. The financial viability of this architecture depends on minimizing the levelized cost of motion or pumping over the system’s lifespan.
How should a solar motor farm be framed as
a business asset
Evaluating a solar motor network requires categorizing it as a long-term, high-yield infrastructure asset. Traditional motor systems are characterized by high variable operating expenses (OPEX), primarily driven by utility tariffs or diesel fuel procurement. In contrast, a solar motor farm acts as a fixed-cost energy hedge. By locking in the cost of energy production at the time of installation, operators can effectively offset grid electricity costs, which typically range from $0.10 to $0.25 per kWh depending on the industrial region. Consequently, asset valuation models must account for a 20- to 25-year lifecycle, factoring in depreciation schedules, tax incentives, and the mitigation of future energy price volatility.
Which business variables most strongly shape operating cost
The operational cost profile of a solar motor farm is shaped by several distinct business variables. Scale is the primary driver; larger utility-scale motor farms benefit from economies of scale in procurement and installation. The operational duty cycle—specifically how many hours per day the motors must run at full load—determines whether expensive energy storage systems or secondary grid connections are necessary. Financing variables also play a critical role; securing commercial interest rates between 5% and 8% APR can significantly alter the break-even point. Finally, regional labor rates for specialized electrical and mechanical maintenance dictate the baseline annual OPEX, requiring careful geographic planning.
What Cost Components Define Total Cost

Accurately forecasting the financial trajectory of a solar motor farm requires dissecting the total cost of ownership into capital expenditures (CAPEX), operational expenditures (OPEX), and replacement expenditures (REPEX). The interplay between these categories dictates the overall financial efficiency of the system.
Which capital, energy, labor, maintenance, and replacement costs
matter most
CAPEX dominates the financial model, typically accounting for 70% to 80% of the total lifecycle cost. This encompasses the PV modules, mounting structures, industrial motors, and specialized solar VFDs. Energy costs post-installation are effectively zero for the solar fraction, but labor and maintenance represent a recurring baseline. Routine OPEX—including module cleaning, vegetation management, and motor bearing lubrication—generally averages between $15 and $25 per kW of installed capacity annually. REPEX must be factored in for power electronics; while solar panels and motors may last 25 years, VFDs and string inverters typically require replacement between years 10 and 15 of operation.
How do solar array sizing, motor efficiency, and storage
strategy affect cost
System sizing directly influences both upfront and recurring costs. To ensure motors can overcome high starting torque requirements during periods of low solar irradiance (such as early morning or heavy cloud cover), engineers typically oversize the solar array. Employing a DC-to-AC ratio of 1.2 to 1.3 is standard practice to maintain stable motor operation. Furthermore, investing in premium efficiency motors, such as IE4 or IE5 synchronous reluctance motors, reduces the total electrical load. This efficiency gain can shrink the required solar array footprint by up to 15%, yielding substantial net savings on structural and PV panel costs. Integrating battery storage to smooth out transients or extend runtimes dramatically increases CAPEX, often adding $300 to $500 per kWh of storage capacity.
Which comparisons best distinguish upfront, operating, and lifec
ycle cost
Distinguishing between upfront, operating, and lifecycle costs is critical for procurement analysis. Upfront costs are heavily weighted toward hardware and grid interconnection, whereas lifecycle costs capture the true long-term value via the Levelized Cost of Energy (LCOE).
| Cost Category | Typical Share of Lifecycle Cost | Primary Drivers |
|---|---|---|
| Upfront (CAPEX) | 70% – 80% | PV Modules, VFDs, Motors, Installation, Permitting |
| Operating (OPEX) | 10% – 15% | Preventative Maintenance, Cleaning, Labor, Monitoring |
| Replacement (REPEX) | 5% – 15% | VFD/Inverter Replacement, Sensor Upgrades |
How Do Design and Site Conditions Affect Cost
The physical environment and the rigorous demands of industrial motor control dictate specific engineering choices. Site conditions heavily influence the degradation rates of components, which in turn affects the frequency and cost of maintenance interventions.
What technical specifications should be evaluated for motors, dr
ives, and controls
Selecting the correct power electronics is paramount for system longevity. Solar VFDs must feature advanced Maximum Power Point Tracking (MPPT) algorithms capable of operating at >98% efficiency to optimize the variable DC input from the solar array. For harsh environments, drives and controls must carry appropriate ingress protection ratings, typically IP65 or IP66, to prevent dust and moisture ingress. Additionally, harmonic filtering components are required to protect motor windings from voltage spikes generated by the VFDs, extending the mean time between failures (MTBF) for the motor insulation systems.
How do irradiance, seasonal variability, dust, temperature, and
water demand affect performance
Environmental variables directly impact system yield and thermal management costs. Soiling losses from airborne dust and agricultural debris can degrade solar output by 2% to 15% if automated or scheduled cleaning is not implemented. Temperature also plays a critical role; standard crystalline silicon solar panels exhibit a temperature coefficient of approximately -0.35% per °C above 25°C, meaning high ambient heat reduces power availability precisely when cooling or irrigation water demand peaks. Elevated temperatures similarly accelerate the degradation of electrolytic capacitors within the VFDs, potentially reducing their operational lifespan by 50% for every 10°C increase above their rated ambient threshold. Water availability for panel cleaning further impacts OPEX, especially in arid regions where reverse-osmosis-treated water must be trucked in to prevent mineral scaling on the PV glass.
What Risks Can Increase Operating Cost
Risk mitigation is a central component of cost control. Unplanned downtime, regulatory hurdles, and supply chain inefficiencies can quickly erode the financial benefits of a solar motor farm if not proactively managed.
How do maintenance planning, spare parts, and remote monitoring
reduce downtime
Unplanned motor or drive failures result in costly operational halts. Implementing predictive maintenance protocols via IoT sensors—monitoring motor vibration, stator temperatures, and VFD fault codes—can identify anomalies before catastrophic failure occurs. Maintaining a strategic spare parts inventory of critical components, roughly 5% of the total hardware value (including fast-acting semiconductor fuses, contactors, and cooling fans), significantly reduces the Mean Time To Repair (MTTR). Remote monitoring platforms operating over cellular or satellite networks allow off-site engineers to perform diagnostics, reducing unnecessary truck rolls that typically cost $150 to $300 per dispatch.
Which permitting, grid interconnection, safety, and environmenta
l requirements add cost
Navigating the regulatory landscape introduces highly variable costs. If the solar motor farm is grid-tied (to sell excess power or draw backup power), utility interconnection studies can range from $10,000 to $50,000, depending on grid saturation and transformer upgrade requirements. Environmental impact assessments, particularly for greenfield sites requiring land clearing or affecting local hydrology, add administrative overhead. Compliance with stringent electrical safety codes, including rapid shutdown requirements and arc-fault circuit interrupter (AFCI) integration, necessitates higher-tier equipment and specialized engineering sign-offs.
How do procurement channels, supplier quality, and logistics aff
ect reliability
The reliability of the system is fundamentally tied to the quality of its supply chain. Procurement channels must prioritize Tier 1 solar modules and industrial-grade motors to ensure defect rates remain below the critical 0.1% threshold. Relying on lower-tier suppliers may reduce initial CAPEX but introduces severe long-term warranty enforcement risks.
| Risk Factor | Potential Cost Impact | Mitigation Strategy |
|---|---|---|
| Component Defect | High (Replacement + Downtime) | Mandate Tier 1 suppliers; require factory acceptance testing (FAT). |
| Remote Logistics | 10% – 15% CAPEX Premium | Consolidate shipping; utilize regional warehousing for spares. |
| Grid Interconnection Delay | Lost yield; extended financing costs | Initiate utility studies during the preliminary design phase. |
How Should Buyers Evaluate ROI and Decide
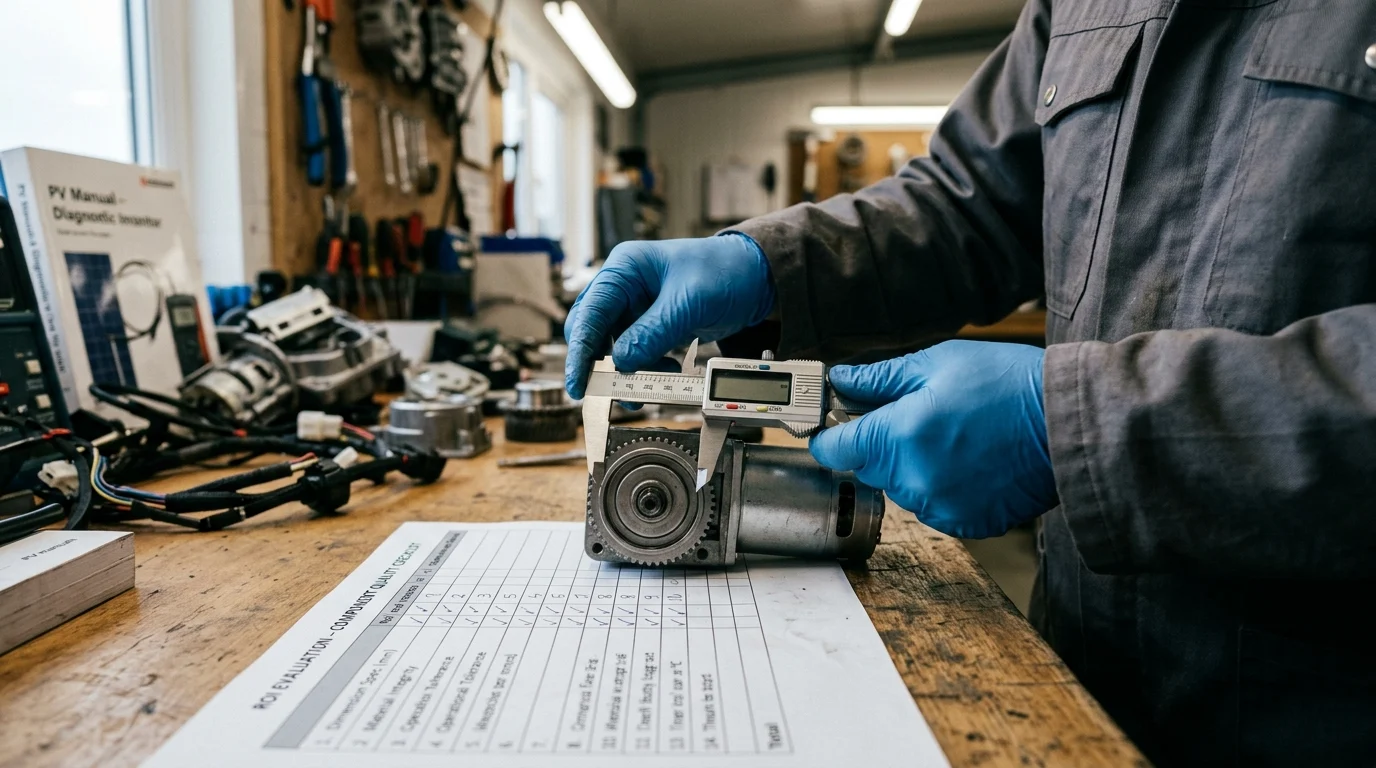
The transition from conceptual design to capital deployment requires rigorous financial modeling. Operators must utilize standardized metrics to ensure the projected savings and operational efficiencies justify the capital outlay over the life of the asset.
What step-by-step process should operators use to estimate ROI
Estimating ROI demands a structured, data-driven approach. First, engineers must develop a precise load profile, mapping the kW demand of the motors across a 24-hour cycle and adjusting for seasonal variations. Second, solar yield simulations using industry-standard software (such as PVSyst or SAM) are executed against historical meteorological data to determine the energy offset. Finally, financial modeling incorporates these technical yields alongside capital costs, tax depreciation, and OPEX projections to calculate Net Present Value (NPV) and the Internal Rate of Return (IRR). For industrial solar motor projects, institutional investors and corporate boards typically target an IRR of 10% to 15% to authorize deployment.
Which decision criteria help determine whether a solar motor
farm is viable
Deciding whether to proceed hinges on specific financial and operational thresholds. A primary metric is the payback period; projects demonstrating a break-even point under 5 to 7 years are generally considered highly viable and low-risk. For off-grid applications currently relying on internal combustion engines, the cost of diesel displacement is the ultimate deciding factor. In regions where delivered diesel costs exceed $1.00 to $1.50 per liter, transitioning to a solar-direct motor system offers immediate operational savings and rapid ROI. Ultimately, the decision rests on aligning the technical capabilities of modern solar drives with the long-term financial strategy of the enterprise, ensuring that energy infrastructure transitions from a variable liability into a predictable, high-performing asset.
Key Takeaways
- The most important conclusions and rationale for Solar Motor Farm
- Specs, compliance, and risk checks worth validating before you commit
- Practical next steps and caveats readers can apply immediately
Frequently Asked Questions
What is the biggest cost in running a solar motor farm?
CAPEX is usually the largest cost, often 70%–80% of lifecycle spend. The main items are PV panels, mounting, motors, and solar VFDs.
How much annual maintenance should I budget for a solar motor farm?
A practical baseline is about $15–$25 per kW each year for panel cleaning, vegetation control, inspections, and motor bearing lubrication.
Do I need batteries for a solar motor farm?
Not always. If daytime operation fits your load, a solar-direct or hybrid setup may avoid batteries. Storage is mainly for night running, transient smoothing, or outage resilience.
How does motor efficiency affect total project cost?
Higher-efficiency motors can cut electrical demand and reduce required PV array size by up to 15%. That lowers spending on panels, structures, and balance-of-system hardware.Eternal Maxx supports intelligent photovoltaic microgrid solutions with day/night energy options for pumps, fans, air coolers, and compressors, helping commercial sites improve reliability and control energy costs.